Hermetic: an experiment in private data analysis with LLMs & Generative UI
tl;dr: GitHub: https://github.com/achalp/hermetic
A few weeks ago I dropped a CSV into Claude and asked it to analyze the data and give me a PowerPoint. It did a great job. Good charts, good structure, useful insights.
Two things stuck with me after that. First, I had just sent my actual data to a cloud service. That was fine for this dataset, but what about financial data, customer data, HR exports? There’s a lot of data that people want to analyze but shouldn’t be uploading anywhere. Second, why a PowerPoint? If the model can figure out the right analysis and the right charts, why not render an actual interactive UI?
Theory
LLMs don’t need to see raw data to write correct analysis code. They only need the schema: column names, types, value distributions, ranges, cardinality, correlations. The structural metadata is sufficient for the model to generate Python code that performs the right groupbys, aggregations, time series operations, and statistical analyses.
If that’s true, then data never needs to leave the user’s machine. The schema goes to the LLM. The generated code runs locally against the real data in a sandbox. And instead of producing a static export, a second LLM call can compose an interactive dashboard from the result schema, streamed to the browser as a live React UI.
Experiment
I built a prototype to test this. Parse a CSV, extract the schema, send it to Claude with a question, take the generated Python, run it in a Docker container, grab the output.
The first version had no UI. Just JSON in the console. But the code was correct across a range of tests: multi-column group-bys, correlations, distribution analysis. The model reasons about structure rather than memorizing values, and that holds up across different datasets and domains.
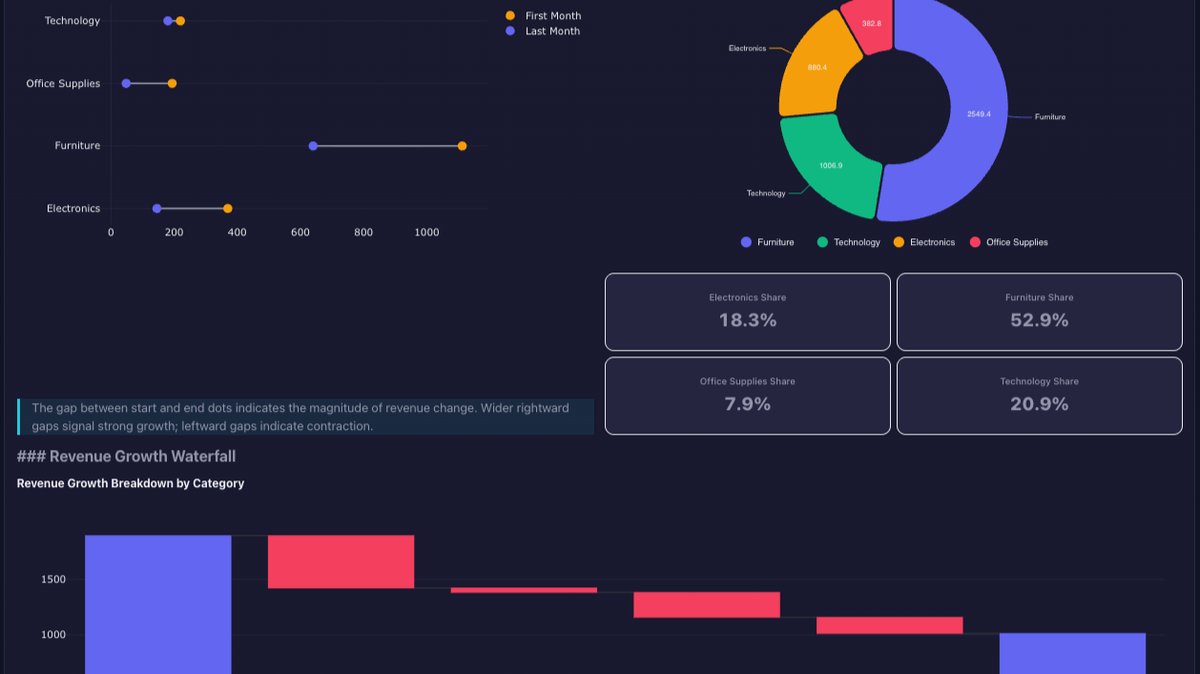
I then added the generative UI layer. A second LLM call receives the shape of the execution results (not the values) and composes a JSON-Render dashboard spec: which chart types to use, how to lay them out, what stat cards to show. The spec streams to the browser and renders as interactive React components. The UI adapts to every question rather than using a fixed template.
Results
It works well enough that I like using it.
I’ve been running it against my bank transaction exports (subscription trends, weekend vs weekday spending, merchant breakdowns), sample project management data, fake survey results, and made up sales CSVs. Different domains, different schemas, same pipeline.
The data never leaves my machine. The schema goes to the LLM. Everything else stays in a microsandbox container with no network access and no access to the host filesystem. Point it at Ollama with a local model and nothing touches the internet at all.
It’s not perfect. Sometimes the generated code errors out and needs a retry. Sometimes the chart layout is off. But the hit rate is high enough that I reach for it often enough.
How it works
The pipeline is three steps:
- Upload a file (CSV, Excel, GeoJSON, JSON). The app extracts the schema.
- Your question plus the schema goes to the LLM, which generates Python code.
- Code runs in a sandbox (Docker, Microsandbox, or E2B). Results feed into a second LLM call that composes a dashboard as a JSON-Render spec, which streams to the browser.
The sandbox has no network access and no access to the host filesystem. Data goes in via stdin, results come out via stdout.
There are 30+ chart types: Nivo for bar, line, pie, radar, sankey, treemap, sunburst, calendar, and others. Plotly for statistical and 3D charts (box plots, violins, histograms, scatter3D, surface plots, candlesticks, waterfalls). deck.gl for geospatial layers. pigeon-maps for 2D marker maps. A few custom SVG components for bullet charts and decision trees. Adding a new chart type is writing a React component and registering it.
You can drill down into chart segments, cross-filter across the dashboard, save visualizations, and re-run them with updated data. If the new file has the same schema, it skips both LLM calls and re-executes the saved code. About 3 seconds.
What’s next
The core idea, separating data from reasoning, works for data analysis. I think it applies to other domains too. There’s a whole category of sensitive data (financial, health, HR, customer PII) that organizations want to analyze but can’t responsibly hand to a third party. Schema-only analysis sidesteps that entirely.
I open sourced it hoping the pattern is worth exploring (or cloning).
Try it out
git clone https://github.com/achalp/hermetic.git
cd hermetic
./start.sh
The script walks you through sandbox setup and API keys.
If you try it, let me know how it goes. If you find bugs, open an issue. If you want to add a chart type or improve a prompt, PRs are welcome. The codebase is approachable. Most components are under 100 lines.