Hermetic: from query box to agentic analysis
TL;DR: Hermetic now supports a multi-step Investigate agent, Snowflake and Databricks, scheduled dashboard runs, editing the generated Python or SQL and re-running, interactive pivot tables, conversational follow-ups with server-side context, persistent history with re-run against fresh data, local Parquet/DuckDB file analysis, and a lot of reliability work across all 32 chart types. Still open source, still local-first. github.com/achalp/hermetic
The last update covered a lot of ground: warehouse connections, local LLM inference, smart suggestions, output styles, the UI redesign. That release made Hermetic usable. What shipped since then is about a specific gap I kept running into.
Hermetic could answer a question, but it couldn’t have a conversation. You’d ask something, see a chart, notice something odd in one of the segments, and then have to start over just to ask the obvious follow-up. That’s not how anyone actually explores data. You build on what you just saw.
That loop (ask, learn, follow up, come back later) is what the last few weeks focused on. But a handful of other things shipped in the same window that are bigger than that framing suggests, so I want to call those out first.
Beyond the conversation loop
In rough order of significance:
Investigate: one question, a full deep-dive
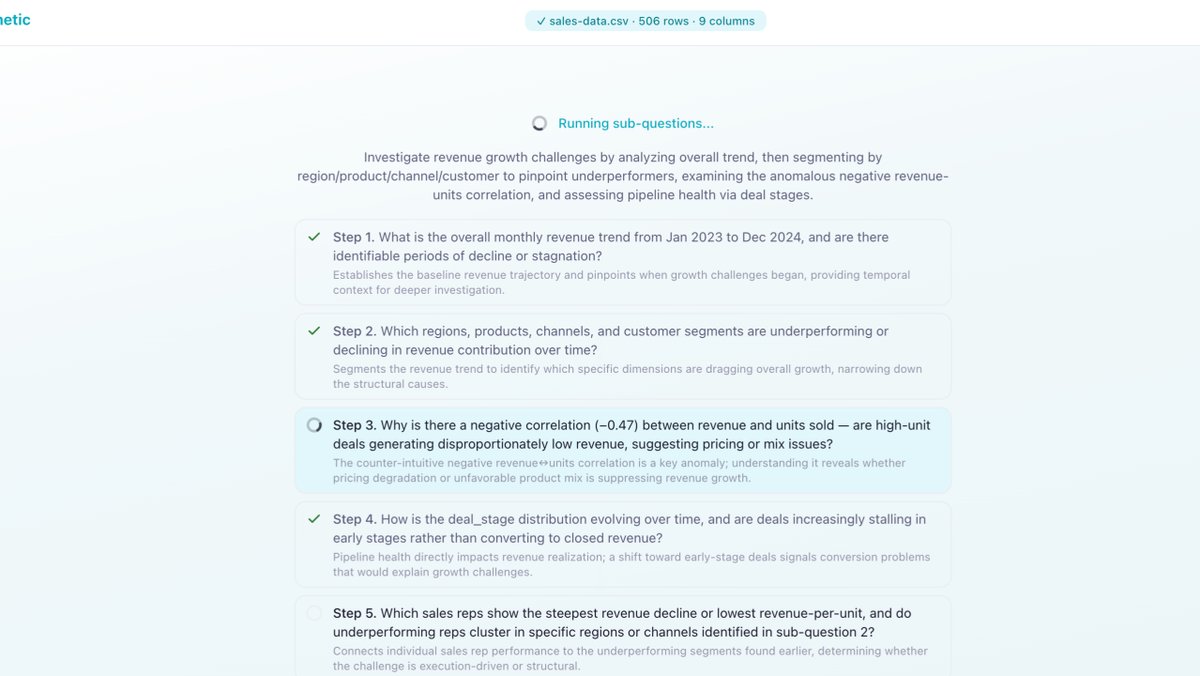
“Investigate” decomposes a question into 3–7 focused sub-questions, runs the independent ones in parallel waves and dependent ones serially, then composes the results into a single dashboard. You ask “why did churn spike in Q1?” once; the planner lays out the analysis, the orchestrator executes each step, progress streams live as a step list with status icons, and a composer synthesizes one unified view at the end. The planner sees schema and stats only, never row values - same privacy posture as a single-shot query.
This is the closest Hermetic has gotten to feeling like an analyst rather than a query box.
Snowflake and Databricks
Warehouse coverage expanded beyond BigQuery, Postgres, MySQL, ClickHouse. Both Snowflake and Databricks have inline and saved connection forms now, with their own tabs and color codes in the UI. dbt metadata enrichment pulls column-level descriptions into the LLM context when a dbt project is wired up.
Scheduled runs
Saved dashboards can now be scheduled. Node-cron under the hood, schedule popover anchored to the dashboard toolbar, schedule pills on saved-viz cards with edit/delete in place. This is the natural extension of persistent history - a dashboard you built last week refreshes itself every Monday morning without you opening the tab.
Edit-and-rerun on the Python or SQL
If the generated code is 90% right, you can edit it directly - Python or SQL - and rebuild the whole dashboard through the standard pipeline. The server skips the generation step for whichever artifact you edited and runs everything downstream. This was the most-requested thing after the charts: “let me just fix the one line.”
Pivot tables that act like pivot tables
The pivot table got sort, drill-through, drill-down, cross-filter against other widgets on the same dashboard, an aggregator switcher, a heatmap mode, and multi-value / multi-aggregator support. It’s now usable as the centerpiece of a dashboard, not just a fallback when a chart didn’t fit.
Retries that learn from failed attempts
When generated code fails, the pipeline retries up to three times - but it carries the full history of failed attempts forward and adds a reflection prompt after two failures. The model sees what it tried and why it broke, not just the original prompt. Catches a meaningful fraction of would-be errors before they reach the user.
Suggested follow-ups
After a fresh analysis, Hermetic now surfaces a few suggested follow-up questions inline. Small thing, but it closes the loop on “what would I even ask next” when you’re staring at a new chart.
Follow-up questions that actually follow up
Hermetic now keeps conversation context on the server. When you ask a follow-up, the LLM gets the full history: what you asked, what code ran, what came back. So “exclude outliers and re-run” works. “Break that down by quarter” works. “Compare that to last year” works, without re-explaining the setup.
In practice this changes how you use the tool. Instead of trying to craft one perfect question, you just start somewhere and iterate. “Show me revenue by region.” OK, interesting, APAC is way up. “What’s driving the APAC spike?” Looks like it’s a few large deals. “Is that seasonal or new?” Each question builds on the last. The tool keeps up instead of making you repeat yourself.
History that sticks around
Before, history was in-session only. Close the tab and it was gone. Now every analysis auto-saves to disk: generated code, results, visualizations. History survives restarts. There’s a dedicated page to browse it, and you can restore any previous result instantly or re-run it against fresh data.
The re-run part matters. A dashboard you built last week re-executes against this week’s numbers. Bookmark the ones you care about. It turns history from a log into something you actually go back to.
Parquet and DuckDB, not just CSVs
The last article announced warehouse connections. What’s new is local Parquet files and Hive-partitioned folders via DuckDB, with a file browser to pick them. No CSV conversion, no upload. Files get bind-mounted directly into the sandbox, zero-copy.
If you’re sitting on exports, data lake snapshots, or analytics outputs already in Parquet, you just point Hermetic at the folder and start asking questions. For anything over a million rows, the system pushes aggregation into DuckDB SQL before touching pandas. That’s the gap between working on sample data and working on the actual files on your laptop.
Charts that don’t break on real data
Chart count went from 8 to 32 across the last two releases. What changed since the last article isn’t new chart types. It’s making all of them actually work.
The rendering was fragile. When the LLM returned chart data as a nested object instead of a flat array (which happens a lot), every chart showed a blank rectangle. Line charts broke on long-format data. Legends overlapped when series names got longer than 12 characters. Axis labels piled up on dense datasets. Some chart labels were 9px, basically unreadable.
Targeted fixes for each:
- Charts auto-unwrap nested data objects, so
{data: [...], x_key, y_keys}works the same as a plain array - Line and area charts detect long-format data and pivot it client-side
- Legends size themselves from actual label lengths
- Labels truncate with tooltips instead of overlapping
- All chart text meets WCAG minimums (12px for UI, 11px for chart labels)
- Every chart supports full-height expanded rendering
None of this shows up in a feature list. But it’s why your charts actually render instead of showing a blank box the first time a column name is longer than “revenue.”
What’s next
A lot landed this cycle, but the rough edges are still where the work is. Better handling of empty warehouse results, smarter date range detection, richer context on follow-ups inside Investigate. After that, I want to see if local inference can get reliable enough that cloud API keys become optional rather than default.
If you’ve tried Hermetic and hit something that didn’t work, that’s genuinely the most useful feedback. Most of the fixes in this batch started with a real failure, not a plan.
GitHub: github.com/achalp/hermetic