Hermetic got a lot better - here’s what changed and why
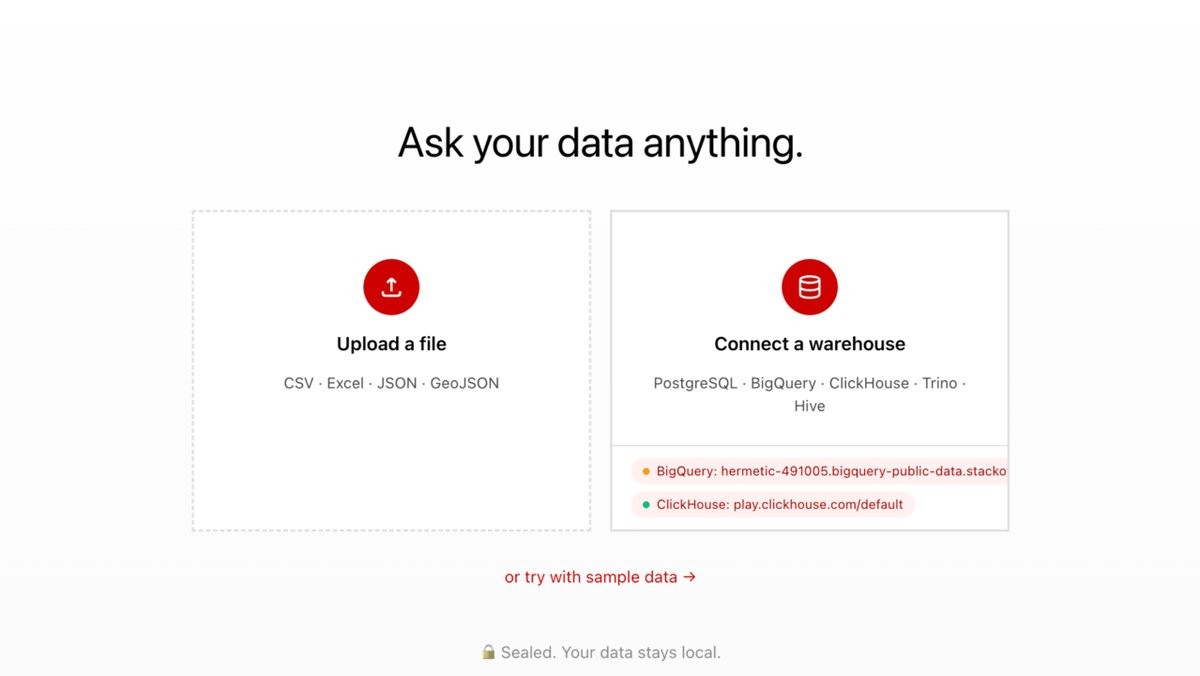
TL;DR: Hermetic - the open-source tool that lets you analyze data without exposing it to LLMs - got a significant update. New UI, warehouse connections, smart question suggestions, and a bunch of things I should have done the first time around. github.com/achalp/hermetic
Sometime back I shared Hermetic - an experiment in using LLMs for data analysis while keeping the actual data private. The core idea: send the schema to the LLM, not the data. Generate code, run it in a sandbox, compose a dashboard from the results.
Since then I’ve been using it frequently, hitting walls, fixing things at nights/weekends, and rethinking some assumptions. Here’s what changed.
Smart question suggestions
After you upload data, the LLM now analyzes your schema and generates 5 questions specific to your actual columns and data types. If you have sales_rep, deal_value, and close_date, it might suggest “Which sales reps are closing the biggest deals, and has that changed quarter over quarter?”
This matters because the original blank input field assumed users know what to ask. That’s fine if you think in SQL. But the whole point of Hermetic is for people who don’t. The LLM already sees the schema - using it to bridge the gap between “I have data” and “I have a question” was an obvious next step I missed the first time.
Heuristic suggestions (generated client-side from column types) show instantly as fallback.
Data warehouse connections
Hermetic now connects to PostgreSQL, BigQuery, ClickHouse, Trino, and Hive. You fill in credentials once, and saved connections show as one-click pills right on the connect card. SQL is generated automatically from natural language, including cross-table JOINs - the LLM sees all table schemas (columns, types, PKs, FKs) and writes dialect-aware queries.
I built this because the file-upload-only model has a ceiling. Interesting data lives in warehouses, not CSVs. And re-entering connection details every session was friction that killed repeat usage. The saved connections pattern - visible by default, one click to reconnect - removes that entirely.
“Show your work” methodology
Every analysis now ends with a plain-English paragraph explaining what happened: how many rows were analyzed, which columns were used, what operations were performed, how many rows were excluded. No code, no jargon.
I added this because I realized I was trusting the results only because I could read the generated Python. A non-technical user has no way to verify. The methodology paragraph costs almost nothing - it’s one instruction in the LLM system prompt - but it changes the trust dynamic. You don’t need to understand the method, you just need to see that one exists.
Six output styles
Before asking a question, you now pick how you want results presented: Dashboard, Narrative, Executive Summary, Deep Analysis, Presentation, or Report. Each produces a fundamentally different layout from the same data and analysis.
The motivation was that a quick “what’s the trend?” question and a “prepare materials for the board meeting” question shouldn’t produce the same output. The output style selector maps to different system prompt blocks that change how the LLM composes the spec - more stat cards for summaries, more prose for narratives, section breaks for presentations.
Analysis history
Previous question-result pairs now persist as collapsed cards above the current analysis. You can scroll back, expand to see a summary, re-run, or delete.
I added this after losing my own work repeatedly. Ask a question, get a good result, ask a follow-up - the first result is gone. It’s session-only (no persistence to disk), but it’s enough to maintain a thread of exploration without losing earlier findings.
Try with sample data
A “try with sample data” link on the home screen loads a bundled 500-row sales dataset through the normal upload pipeline. The question suggestions generate automatically.
This should have been in v1. The activation energy of “find a CSV, make sure it’s clean, upload it” is surprisingly high for a first-time experience. Sample data lets someone see the full flow in 10 seconds.
UI redesign
The interface was rebuilt around a simpler flow: connect data → choose output style → ask (with suggestions below) → see results. Technical settings (LLM provider, local models, sandbox runtime, themes) moved into a settings drawer - one gear icon click away, invisible by default.
Other changes:
- Data explorer: a collapsible right-side rail showing table schemas, column types, distributions, and sample rows. For warehouses with many tables, a split-pane layout with draggable divider.
- Artifacts panel: a bottom sheet showing generated SQL, Python code with syntax highlighting, and computed data tables. Copy, download, or export.
- Light / Dark / System mode: four themes (Focus, Stamen, Info is Beautiful, Pentagram), each with light and dark variants.
- Local model support: MLX (Apple Silicon), llama.cpp, and Ollama — detect, download, and activate models from the settings panel.
How Hermetic compares to similar tools
This is somewhat facetious and vain but sometimes comparisons help to paint what a tool can do relative to others. My hope is that this can inspire some to try, and for others, it saves them time and effort because Hermetic isn’t right for them. To be clear, I haven’t used most of these tools hands-on, and this table is based on their marketed and published capabilities (researched by Claude of course):
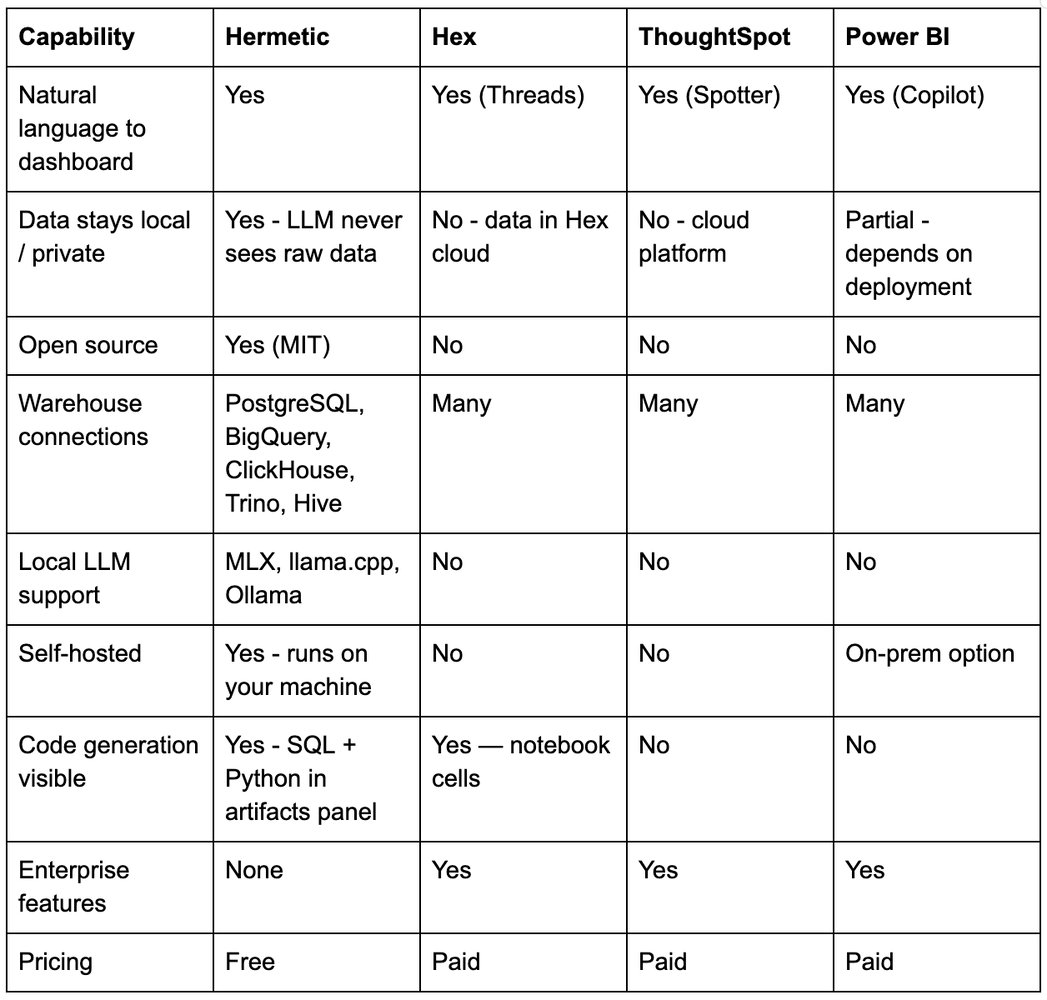
Hermetic isn’t trying to be an enterprise BI tool. It’s a single-user, privacy-first analysis tool that runs on your laptop. The trade-off is clear: no collaboration, no scheduling, no governance — but also no data leaving your machine and no subscription.
What’s next
There’s still a lot I want to improve - inline refinement (“change this to weekly”), shareable links for results, universal filtering independent of what the LLM generated. The generated dashboards are good but not always what you want on the first try, and the iteration loop is still “type a new question.”
If you try it and something doesn’t work or doesn’t make sense, open an issue. The repo is at github.com/achalp/hermetic.
Follow-up to Hermetic: An Experiment in Private Data Analysis with LLMs & Generative UI